Loading...
Back to Projects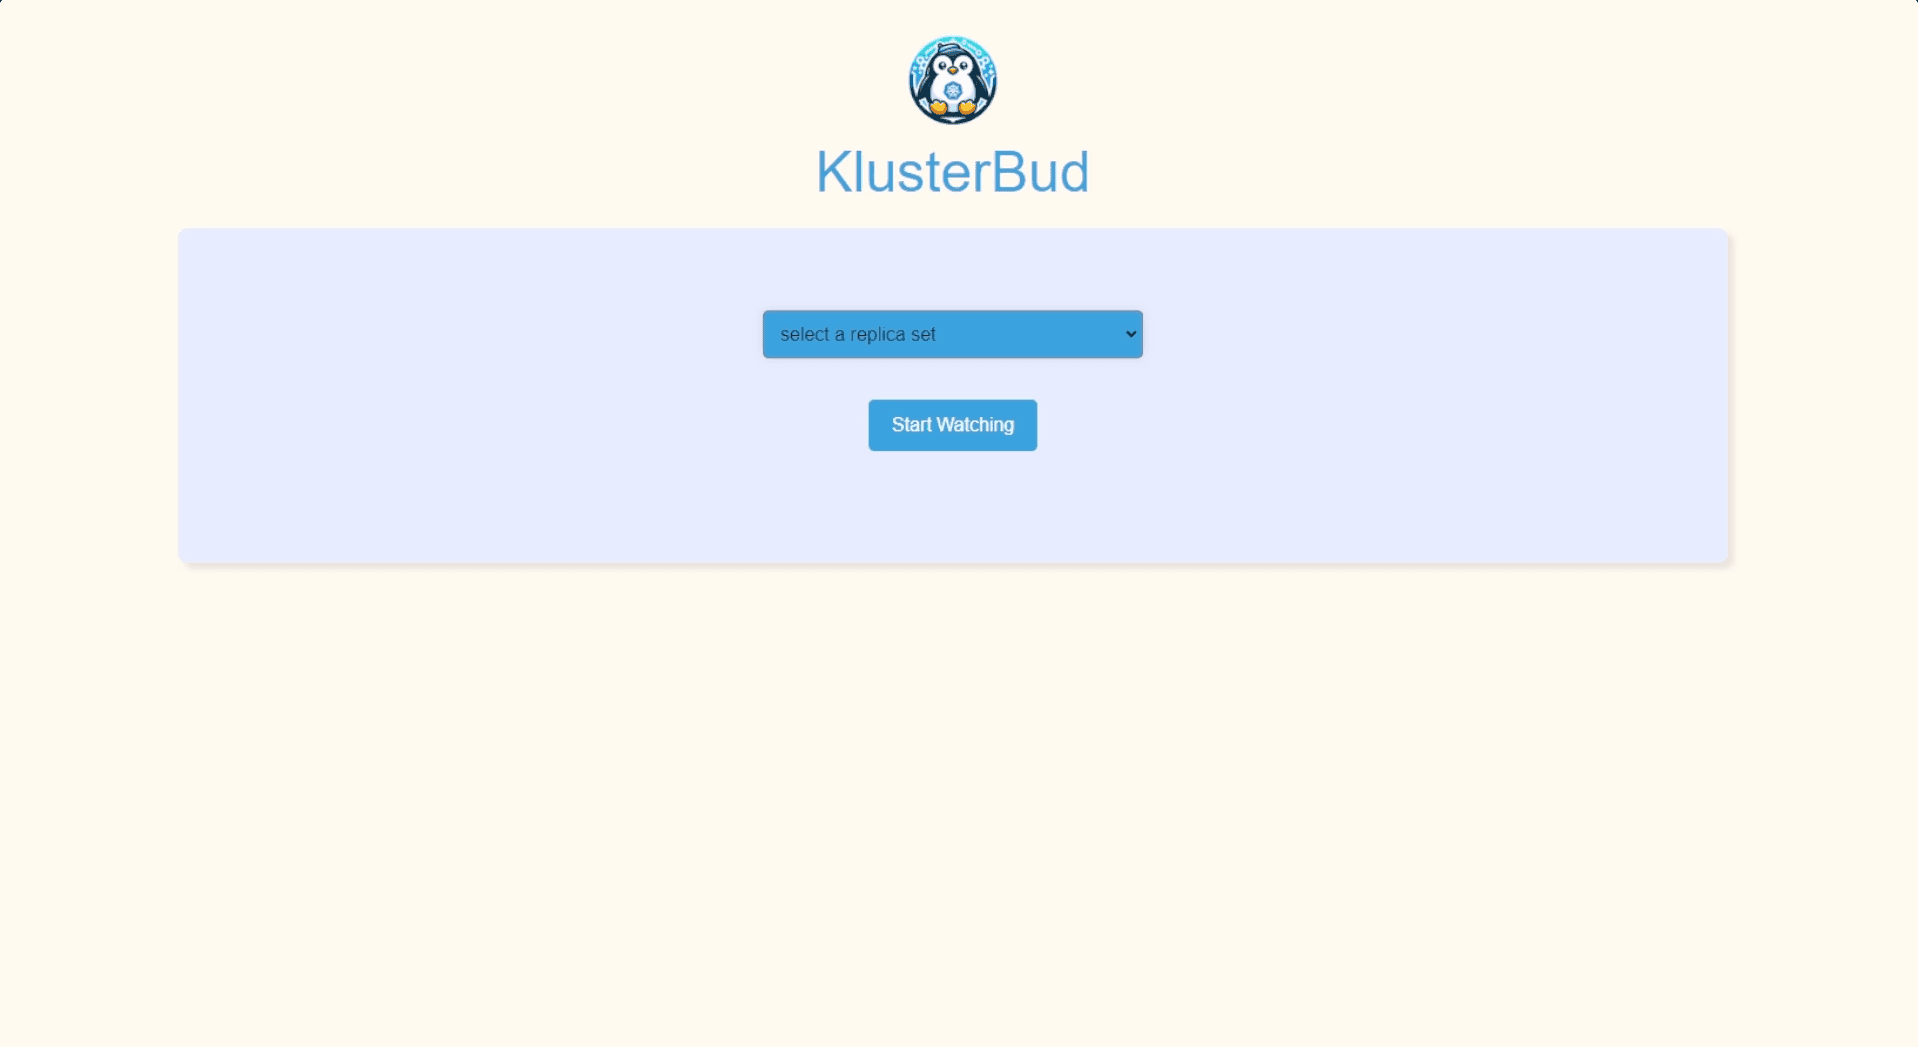 Completed
KlusterBud
Kubernetes monitoring platform
Improved Kubernetes debugging by surfacing replica set health, Prometheus metrics, and anomaly detection in one developer-focused interface.
Overview
A full-stack Kubernetes observability platform enabling developers to monitor replica set health, detect anomalies, and visualize Prometheus metrics through an intuitive dashboard.
Highlights
- Custom PromQL queries against live Prometheus instances
- Visualization of replica set anomalies
- Continuous monitoring of Kubernetes workloads
Technologies
ReactNode.jsExpressDockerKubernetesHelmPrometheusGrafanaAWS
System Architecture
Dashboard
- React
Backend API
- Node.js
- Express
Metrics
- Prometheus
- PromQL
Infrastructure
- Kubernetes
Engineering Insights
A cloud-native observability platform that simplifies Kubernetes monitoring by combining cluster health, Prometheus metrics, and workload status into a unified developer dashboard.
Problem
Debugging Kubernetes clusters often requires developers to switch between kubectl, Prometheus, and Grafana to understand workload health and cluster behavior. This fragmented workflow increases context switching, slows investigations, and makes observability less approachable for engineers who are still becoming familiar with Kubernetes.
Architecture
KlusterBud consists of a React frontend communicating with a Node.js and Express backend that interfaces with Kubernetes and Prometheus. The backend retrieves cluster metadata, executes PromQL queries, and exposes a simplified API that allows the frontend to visualize node health, replica status, and resource utilization through a unified dashboard.
Technical Decisions
Prometheus was selected as the metrics source because it integrates naturally with Kubernetes while providing a flexible query language through PromQL. React enabled a responsive dashboard composed of reusable UI components, and Express served as a lightweight API layer responsible for communicating with Kubernetes services and aggregating observability data for the client.
Engineering Challenges
One of the primary challenges was presenting complex infrastructure metrics in a way that remained useful without overwhelming developers. Designing reusable dashboard components, coordinating asynchronous metric requests, and surfacing meaningful anomalies required balancing technical accuracy with an intuitive user experience.
Results
KlusterBud consolidated cluster health, replica status, and Prometheus metrics into a single interface, allowing developers to monitor workloads, inspect resource utilization, and identify abnormal behavior without continuously switching between multiple observability tools.
Lessons Learned
Building KlusterBud reinforced the importance of designing developer tooling around developer workflows rather than individual technologies. The project provided valuable experience working with Kubernetes APIs, Prometheus, distributed systems, and full-stack application architecture while emphasizing the value of thoughtful abstractions.